Why this matters when you choose a model in Verdent
You start the same issue twice in Verdent. One run reads the relevant files, patches the root cause, runs the right tests, and stops. The other scans half the repository, replays large tool results into context, edits the symptom, fails verification, and starts again. The second model can be cheaper per million tokens and still cost more per accepted change.
That is the practical distinction behind this guide. An API price card measures token consumption. As a Verdent user, you pay for a useful outcome after planning, file reads, tool calls, tests, retries, review, and sometimes your own recovery work. The useful denominator is therefore not a request or a million tokens. It is an accepted task:
cost per accepted task = cost of every attempt, including failures and rescues / accepted tasks
This article compares Claude Fable 5, Kimi K3, Claude Opus 5, GPT-5.6 Sol, and GLM-5.2 through that lens. It starts with a shared benchmark methodology, then checks the conclusion against published agent traces. Scores are included only when needed to interpret consumption; token use and dollars are the main evidence.
The goal is not to name one permanent winner. Verdent's model lineup and provider behavior can change, and the five models in this comparison may not be available through every route at every moment. The useful result is a way to choose between Auto, a pinned model, a lower-cost route, or BYOK using evidence from your own tasks. Verdent's guide to supported coding models makes the same routing point: use stronger models for architecture and difficult refactors, code-focused models for implementation, and cheaper models for simple edits.
Prices and public measurements were checked on July 30, 2026. Provider rates, default effort, routing, and caching policies can change. Recheck the linked sources before making a routing decision.
The same evaluation produces very different token bills
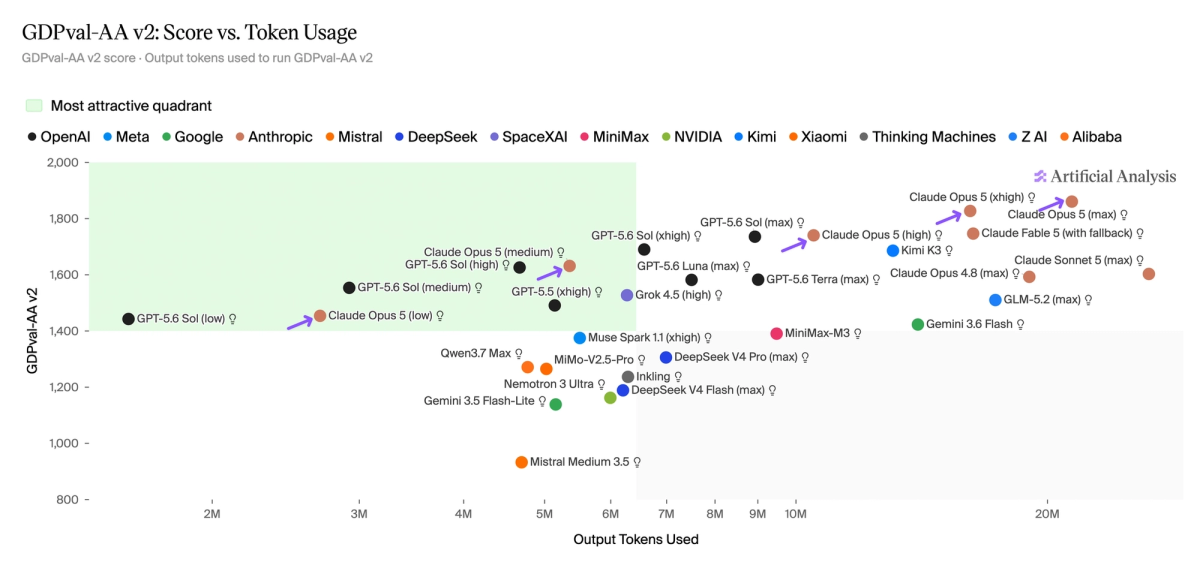
The shared GDPval-AA v2 plot puts all five assigned models on a score-versus-output-token plane and exposes the wide effect of effort settings.
Source: Artificial Analysis — GDPval-AA v2 score versus token usage.
Artificial Analysis now publishes a useful cross-model cost framework. Its methodology standardizes cross-model throughput in OpenAI-token units, keeps provider prices in native tokens, and defines cost per task as a weighted average across the Intelligence Index. That cost includes input, cached input, cache writes, reasoning, and answer tokens. This is much closer to workload economics than comparing output rates alone.
The following table joins the current model pages and launch analyses. “Index output” is the total output generated while running the complete Intelligence Index, excluding repeats. “Cost/task” is the separately weighted per-task metric; it should not be derived by dividing the total columns because benchmark weights and task counts differ.
| Model and setting | Index score | Index output | Cost per Index task | Cost to run full Index | Output list price |
|---|---|---|---|---|---|
| Claude Opus 5, max | 61 | 100M | $2.03 | $3,835.51 | $25/M |
| Claude Fable 5, max, with fallback | 60 | 87M | $2.75 | $5,630.52 | $50/M |
| GPT-5.6 Sol, max | 59 | 70M | $1.04 | $3,442.81 | $30/M |
| Kimi K3, max | 57 | 130M | $0.94 | $2,437.41 | $15/M |
| GLM-5.2, max | 51 | 140M | $0.32 | $765.07 | $4.40/M |
Sources: Artificial Analysis model and launch pages for Opus 5, GPT-5.6 Sol, Kimi K3, GLM-5.2, and Fable 5.
Three relationships matter more than the ranking when you are deciding what should run a Verdent task.
First, Kimi's $15/M output price is half of Sol's $30/M, but their measured cost per task is almost the same: $0.94 versus $1.04. Sol used about 15,000 output tokens per weighted Index task, while the Kimi K3 model page places Kimi at about 23,000. Kimi's cheaper tokens are partially consumed by a longer trajectory.
Second, Fable's output rate is more than eleven times GLM-5.2's, yet cost per task is about 8.6 times higher, not eleven times. GLM is cheap in dollars but is the most verbose of the five in total Index output. Low price and token efficiency are different properties.
Third, Opus 5 is the strongest example of a higher unit price buying trajectory compression. It charges the same input rate as Sol and a slightly lower output rate, but costs nearly twice as much per Index task at max effort because it uses much more test-time compute. Against Fable, however, Opus reaches a slightly higher score at 26% lower cost per task. “Expensive” depends on which alternative, effort level, and task you mean—not only which label appears in the model selector.
Effort can move consumption more than the model name
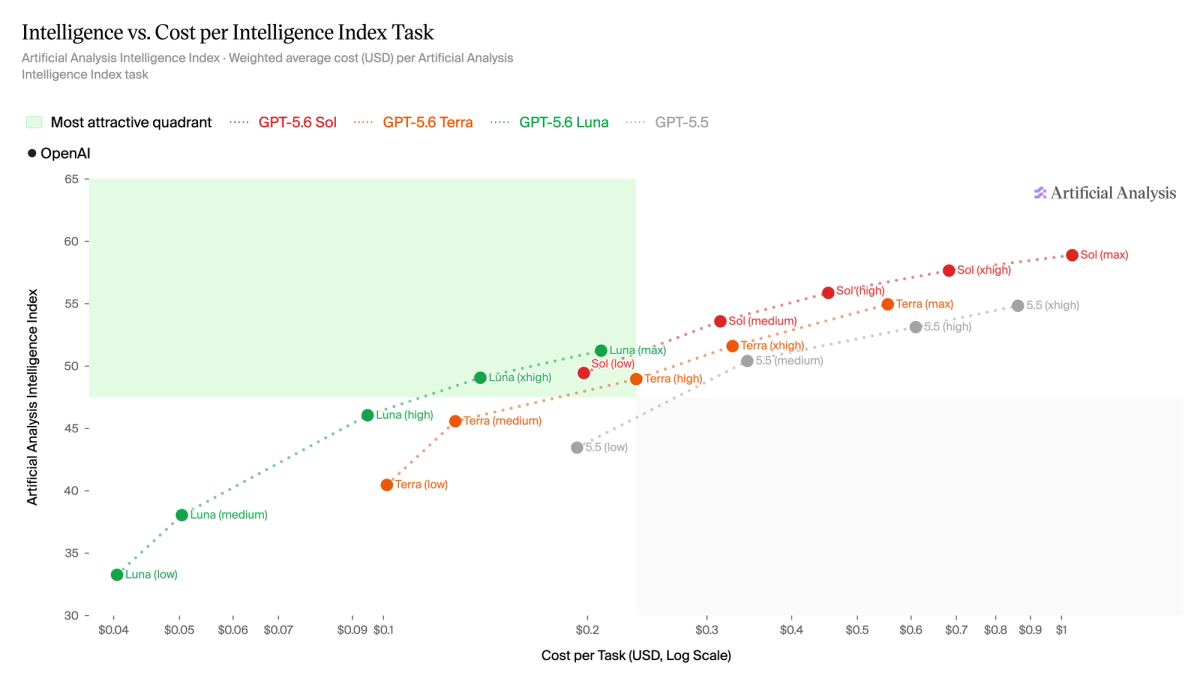
Sol's low-to-max curve shows that selecting an effort level is itself a cost decision; max is not a neutral default.
Source: Artificial Analysis — GPT-5.6 effort levels on the intelligence-cost frontier.
The five model names are not single operating points. Reasoning effort changes how much test-time compute the model spends before it stops. Artificial Analysis measured the following curves on the same Index:
| Effort | Opus 5 score | Opus 5 Index output | GPT-5.6 Sol score | Sol Index output |
|---|---|---|---|---|
| Low | 51 | 12M | 49 | 6.6M |
| Medium | 56 | 29M | 54 | 12M |
| High | 59 | 52M | 56 | 21M |
| Xhigh | 60 | 76M | 58 | 35M |
| Max | 61 | 100M | 59 | 70M |
The last point on each curve is especially revealing. Sol moves from xhigh to max for one additional Index point while doubling output from 35M to 70M. Opus moves from xhigh to max for one point while output rises from 76M to 100M. Depending on the acceptance threshold, max can rescue a difficult task or simply over-compute a routine one.
The Opus 5 analysis shows an approximately eightfold output-token range between low and max on GDPval-AA v2. The GPT-5.6 analysis identifies Sol as a token-efficiency frontier at max, but its own effort curve still spans more than tenfold from low to max across the full Index. A comparison that writes only “Opus 5” or “Sol” is therefore missing the setting that controls consumption.
Kimi K3 also launched at max effort by default, while lower-effort modes were deferred. GLM-5.2 exposes multiple effort levels, and Z.ai's published coding curve shows output tokens rising with effort. Comparing Kimi max, GLM max, Sol medium, and Opus xhigh is a routing-policy comparison, not a pure model comparison.
Real agent runs show why list-price ratios collapse
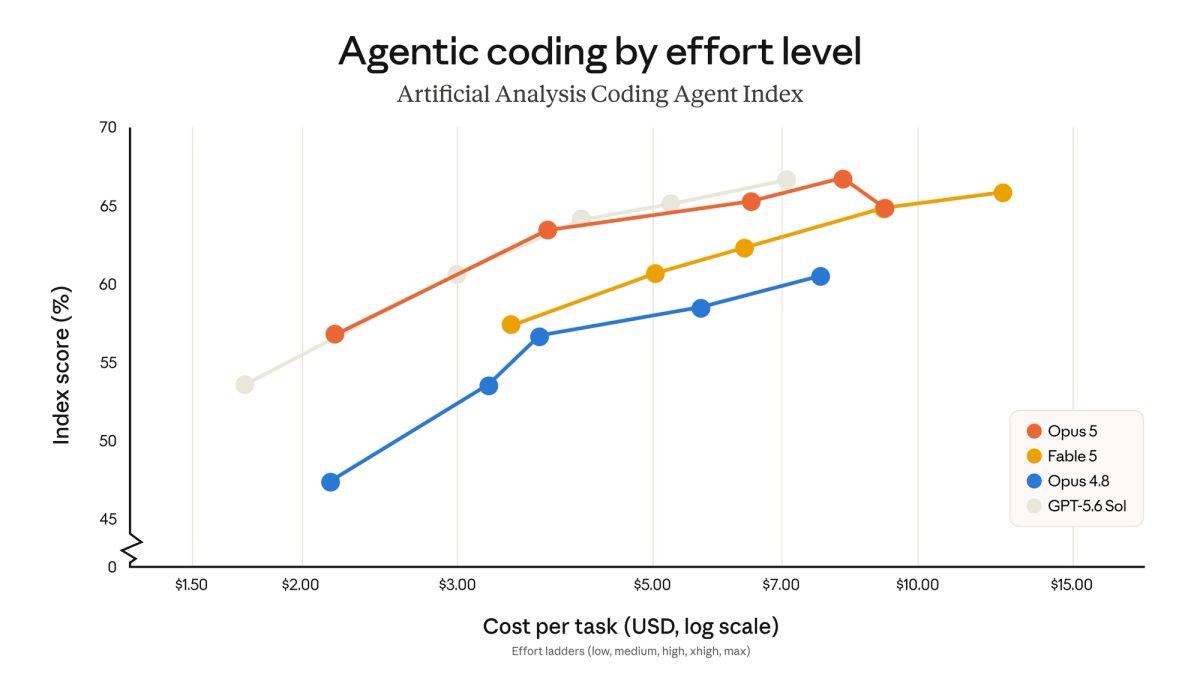
Anthropic's launch chart shows model-plus-effort operating points rather than a single model price; the practitioner tables in this section add harness-level evidence.
Source: Anthropic — Coding-agent score versus cost by effort level.
Benchmarks standardize tasks. Repository traces reveal what the agent harness does to the bill. A detailed 120-run practitioner study replayed eight graded agent tasks with prompt variants and repeats. Every run passed, so cost was not confounded by different pass rates.
| Model + harness | Passed runs | Cost per full pass | Wall time | Refactor tool calls |
|---|---|---|---|---|
| GPT-5.6 Sol + Codex CLI | 24/24 | $1.25 | 305s | 5 |
| Kimi K3 + Kimi Code CLI | 24/24 | $1.48 | 1,586s | 18 |
| Kimi K3 + Claude Code | 24/24 | $2.04 | 891s | 13 |
| Fable 5 + Claude Code | 24/24 | $4.62 | 690s | 12 |
| GPT-5.6 Sol + Claude Code proxy | 24/24 | $4.46 | 1,085s | 32 |
The most important row pair is the same Sol model in two harnesses. Under Codex it cost $1.25 per pass and used five refactor tool calls. Through a Claude Code proxy it cost $4.46 and used 32. The harness changed cost by 3.6 times—more than many model price differences. Kimi also moved from $1.48 in its own CLI to $2.04 in Claude Code.
Input volume alone did not determine the result. The study reports roughly 1.9M input tokens per Sol/Codex pass, 1.28M for Fable, 1.38M for Kimi in Claude Code, and 1.79M for Kimi Code. Sol still won on cost because 82% of its input hit the discounted cache and it made far fewer tool calls. The invoice reflects token category and control flow, not just token count.
A second, smaller 12-task multi-app agent test reported a different but compatible pattern:
| Model | Passed | Tokens per case | Cost per case, no cache discount |
|---|---|---|---|
| Kimi K3 | 7/12 | ~463k | ~$1.39 |
| GPT-5.6 Sol | 6/12 | ~538k | ~$2.69 |
| Fable 5 | 7/12 | ~776k | ~$7.76 |
This is practitioner evidence, not a controlled lab result. GPT used Codex while Kimi and Fable used Claude Code; the author normalized some runtime token counts and explicitly says the ratios are more reliable than the exact dollars. Still, it directly falsifies the assumption that Kimi must consume more tokens simply because its max-effort benchmark is verbose. On those shorter SaaS tasks, it used the fewest.
The apparent contradiction is the point. Token efficiency is workload- and harness-specific. A model can be verbose on a broad reasoning index and concise on a tool-use template. These CLI results should not be read as Verdent price predictions; they show why the surrounding agent loop matters. One public average cannot replace a replay test on your own project.
Cheap tokens can fund expensive behavior
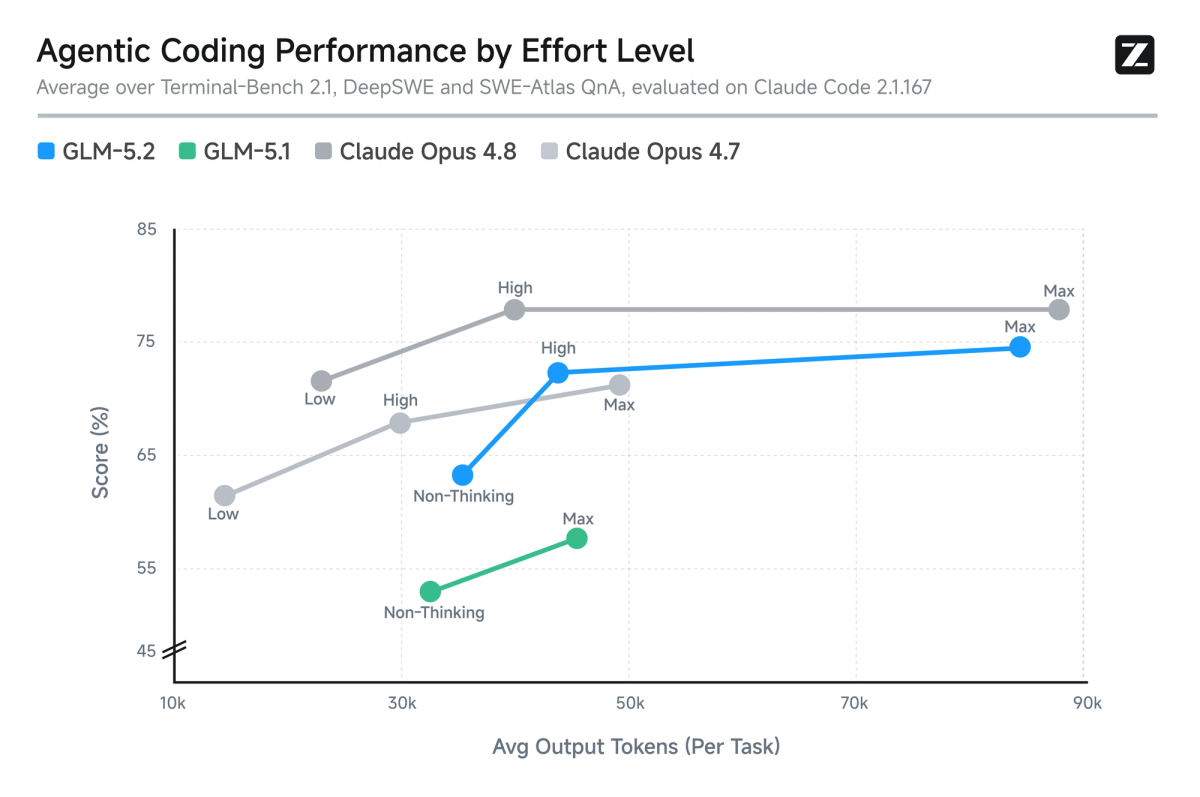
Z.ai's effort curve makes the token side of test-time compute explicit: more effort can raise quality and consumption together, but the return is not linear.
Source: Z.ai — Agentic coding score versus average output tokens per task.
The most misleading model comparison is the one that stops at the rate card. A coding agent does not buy one clean block of output. It repeatedly buys context: repository rules, tool schemas, files, command results, test logs, prior mistakes, and the conversation that explains those mistakes. Every unnecessary turn can feed the previous turn back into the next bill.
That is how a bargain model becomes expensive without ever changing its advertised price. It reads too broadly, explains too much, calls another tool because the first call was poorly targeted, loses the thread, and tries again. The waste is not always visible in the final answer. It lives in the route taken to get there.
The 120-run study makes this concrete. Sol needed five refactor tool calls in Codex and 32 through a Claude Code proxy. The model name and list price did not change, but the cost rose from $1.25 to $4.46. If the harness alone can create a 3.6× spread, a price-card ranking cannot possibly predict your project bill.
The research literature is even less comforting. A 2026 study of token consumption in agentic coding found that input, not the visible answer, drives most agent cost. Repeated runs on the same task differed by as much as 30×, and spending more tokens did not reliably improve accuracy. Models also differed substantially in token efficiency on identical tasks and systematically underestimated their own eventual consumption.
This is why “the cheap model failed, so I ran it again” is not a harmless workflow. The rejected attempt still bought all of its reads, reasoning, tools, and logs. Two failed cheap runs plus one rescue run can easily cost more than sending the task to a pricier model that recognizes the root cause and stops. The premium model is not cheaper per token. It can be cheaper because it needs fewer of them to reach an acceptable result.
Users keep rediscovering that the sticker price is not the bill
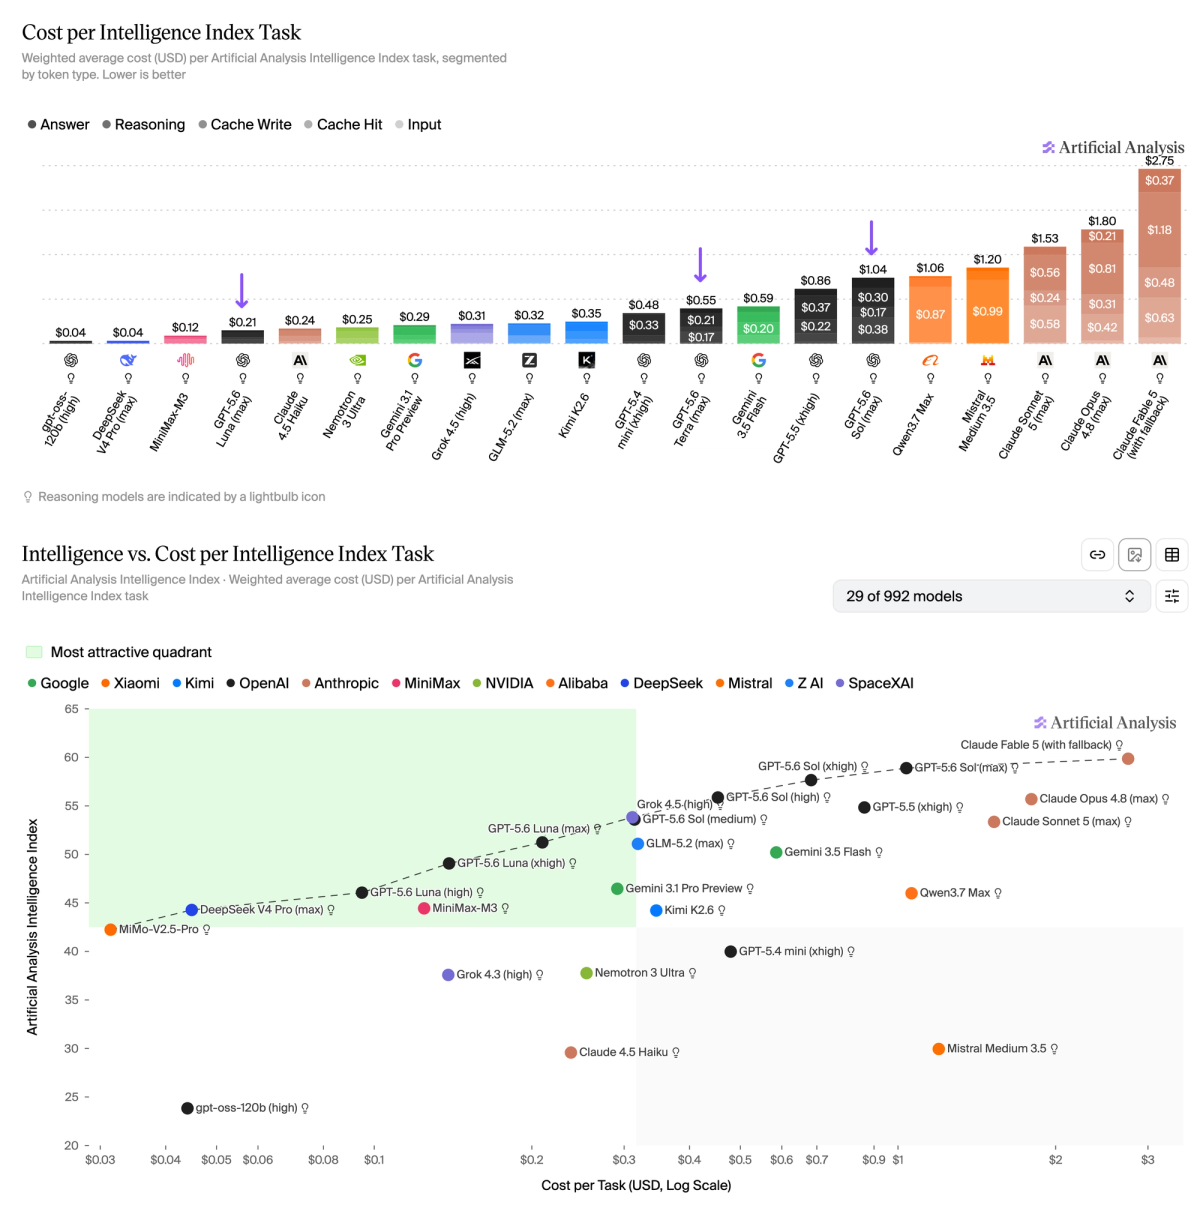
Cost per task compresses token price, token volume, cache mix, and reasoning into one workload metric; the stacked bars show why the same headline rate can yield a different bill.
Source: Artificial Analysis — Cost per Intelligence Index task by token category.
Community reports are noisy, but the useful ones show their receipts and admit their limits. One small controlled Reddit test gave Opus 4.7 and Sonnet 4.6 the same one-line bug. Both fixed it. Opus produced 141 output tokens; the cheaper Sonnet produced 795. Their final costs were almost identical—$0.0136 versus $0.0124—because verbosity consumed nearly all of Sonnet's per-token advantage. The author correctly labels it n=1, not a benchmark. It is still a clean demonstration of the mechanism.
In another Reddit discussion about Opus consumption, one practitioner stated the counterargument plainly: if Sonnet fails and is rerun three times, it can cost more than using Opus once. Other commenters described the same tradeoff in less tidy terms—cheaper models created more review and rework, while expensive models avoided dead ends on architecture and ambiguous refactors. These are opinions, not controlled measurements, but they explain why teams that pay the invoices often sound less impressed by low headline rates than leaderboard spectators do.
The reports also disagree, which is exactly why no model deserves a universal efficiency crown. In a current Opus 5 usage thread, some users describe unusually low consumption and say it finally feels competitive with Codex; others report instant limit exhaustion or agent fan-out that destroyed the savings. Effort, context setup, MCP schemas, delegation, product bugs, and subscription accounting are tangled together. A screenshot of a usage meter cannot isolate the model.
Kimi provides the necessary counterexample to any simplistic “premium always wins” story. In the 12-task community run above, Kimi K3 matched Fable's 7/12 score while using the fewest tokens and costing about one-sixth as much. The author disclosed the mixed harnesses and warned that the ratios matter more than the exact dollars. Kimi's low rate did not hide poor token efficiency on that workload; it amplified good token efficiency. Cheap models can absolutely be genuinely cheap—they just have to prove it in the run, not in the pricing table.
Put the reports together and the sharp conclusion is not that expensive models are secretly always economical. It is that unit price has almost no authority by itself. GLM-5.2 can win by being dramatically cheaper even while verbose. Kimi can win twice, on both price and token count. Sol can look exceptionally efficient in Codex and painfully inefficient in the wrong harness. Opus can spend more deliberate reasoning yet beat a cheaper model by avoiding wandering and retries. Fable's premium is justified only when its accepted result saves enough failed work to cover it.
Try the models on work you actually do
You do not need to build a cost-accounting system to make a better choice in Verdent. Take one task you genuinely care about—a stubborn bug, a representative refactor, or a workflow that regularly needs human rescue. Run the candidates with the same repository state and acceptance test. Include every retry. Then ask two questions: did the result pass, and what did the complete attempt actually cost?
Do it more than once. The paper's 30× same-task spread is a warning against declaring a winner after a lucky run. Keep the model, effort, and route visible, because the RingMod data shows that the harness can reverse the result. If you use BYOK, Verdent's BYOK guide gives you a direct provider bill to compare with the accepted change.
The decision can remain simple. Use the cheaper route when it finishes cleanly. Pay for the stronger model when it consistently prevents retries, wrong turns, or manual rescue. Recheck when the task type, effort level, or agent route changes.
Do not ask which model has the cheapest tokens. Ask which one gets your task accepted with the least total waste. The pricing page is a promise about units. The finished task is the receipt.