"Six ad accounts, three regions. Every data pull meant a ticket and a three-day wait. One message to Verdent — I got validated data across all dimensions and a dashboard. Now I run it myself every Monday."
Elena Vargas runs growth at a B2B software company, managing six Google Ads accounts across three regions. She knows the questions — which campaigns are burning budget, how mobile and desktop conversion rates differ, which search terms actually drive revenue. What she doesn't have is a way to answer them without submitting a request to the data engineering team and waiting days.
She described what she needed to Verdent in a single message — campaign metrics, ad group performance, keyword quality scores, search terms, landing page conversions, geographic and device breakdowns, fourteen days across all of it — and Verdent handled the rest. It started by exploring the Google Ads API itself, running sample queries across all eight dimensions to confirm which fields were actually available before writing a single line of pipeline code. It then produced a technical design — query strategy, storage format, visualization plan — and reviewed the design through its own orchestration layer before approving execution. The pipeline script it built ran against three accounts and pulled all the data in minutes — a task that previously took days of waiting. Then it split into two parallel tracks: one validating data quality across five categories (all 8 dimensions passed), the other generating an interactive HTML dashboard with six charts. What Elena received wasn't a one-off data export — it was a set of standalone, reusable scripts she could run again next week without filing another ticket.
From days of waiting to minutes. From a report to a tool. Here's how it happened.
One Message, Eight Dimensions
Elena described her needs in plain language — campaign spend, conversions, and ROAS; ad group performance; keyword quality scores; actual search terms triggering her ads; landing page conversion rates; geographic and device breakdowns. She didn't specify API fields, query structure, or storage format. She described what she wanted to know, not how to build it.
It Started by Exploring the API Itself
Before writing any code, Verdent called the Google Ads API to run sample queries across all eight dimensions. It was checking which fields were actually available, how much data existed, and whether the planned queries would work — using only 16 of the daily API call limit, less than 1%.
The result: 207 usable fields confirmed across all eight dimensions.
"I've seen AI tools just start writing code and hope for the best," Elena said. "This one checked its assumptions first."
The Plan Got Reviewed Before Anything Ran
After exploration, Verdent produced a technical design — query strategy, storage format, geographic name resolution, visualization plan. Then, instead of executing immediately, its orchestration layer reviewed the design, evaluating each piece before approving the next step.
This is the difference between an AI tool that executes blindly and one that checks its own work. The pipeline was built only after the plan passed review.
The Pipeline
The pipeline script: 782 lines. Reading credentials, constructing queries for all eight dimensions, handling pagination, writing results to local Parquet files. Three accounts, fourteen days of data, all eight dimensions — pulled in minutes, not days.
"My last data request like this took four business days from ticket to delivery," Elena said. "This time I didn't even need to leave my chair."
Validation and Dashboard, in Parallel
Two things needed to happen next: verify the data and build the visualization. They're independent, so Verdent ran them simultaneously.
Validation covered five categories — row counts, date continuity, primary key completeness, non-negative metrics, cross-dimension consistency. All eight dimensions passed.
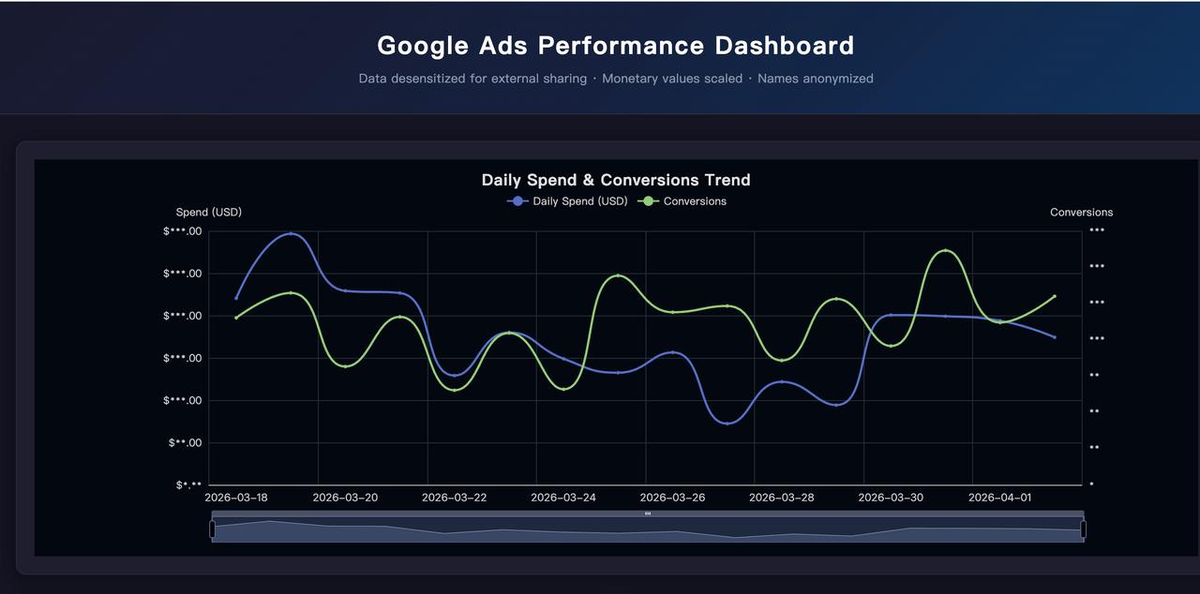
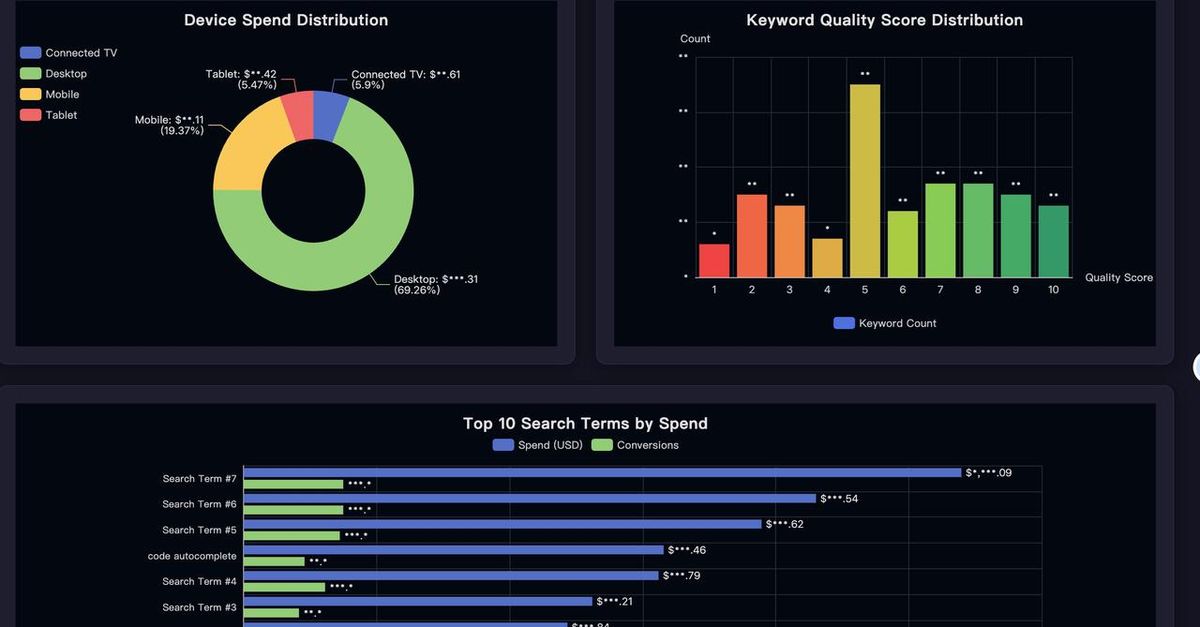
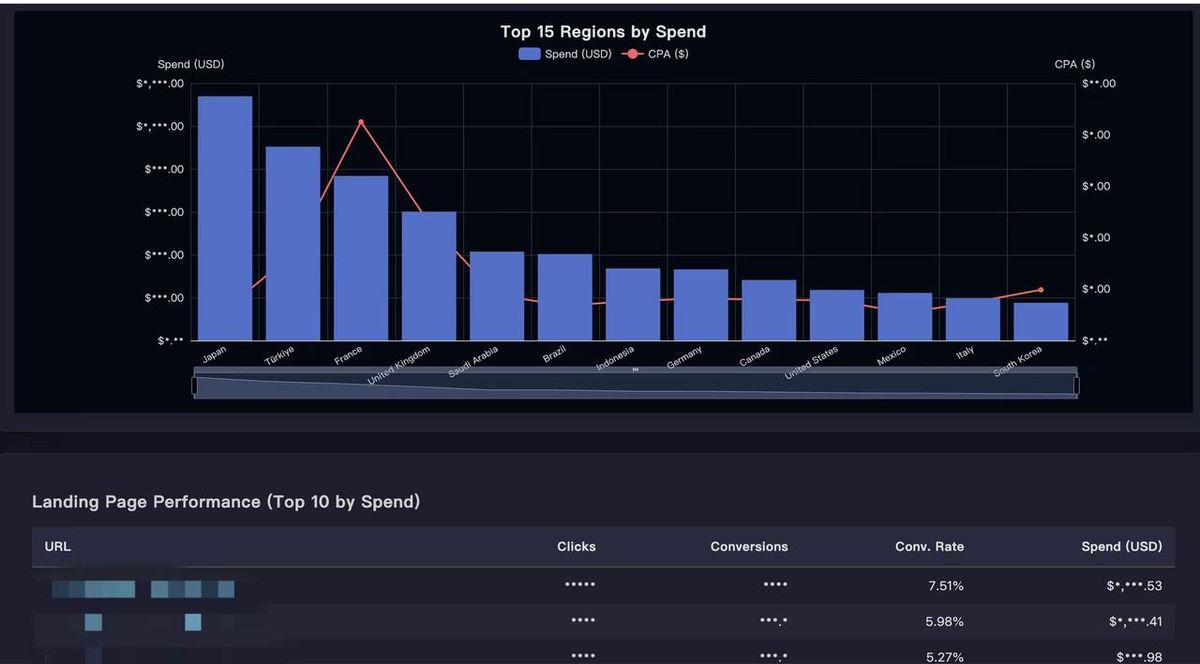
The dashboard came out as a single HTML file with six interactive charts — spend and conversion trends, device distribution, keyword quality scores, top search terms by spend, geographic distribution, and landing page performance. No BI tool. No database connection. Just open the file.
What She Got
Not a report — a reusable project. An API exploration script. A 782-line data fetching script. A validation script with automated quality checks. A dashboard generator. Documentation tying it all together.
"The part that mattered most to me wasn't the speed," Elena said. "It was that I could run it again next week, and the week after that. I didn't get a report — I got a tool."
What Changed
| Before | After | |
|---|---|---|
| Time to data | Days (ticket → backlog → delivery) | Minutes, self-service |
| Dependency | Data engineer availability | Run it yourself, anytime |
| Dimensions | Whatever the engineer had time to pull | All 8 requested, every time |
| Validation | Manual spot-checks, if any | Automated 5-category checks, 8/8 pass |
| Visualization | Request a dashboard build, wait | Interactive HTML, generated automatically |
| Reusability | One-off analysis, start over next time | Standalone scripts, rerun on demand |
Takeaways
Describe what you want to know, not how to build it. Elena didn't write GAQL queries or specify API fields. She said "campaign spend, conversions, ROAS" and "search terms that actually trigger my ads." Verdent translated business questions into technical implementation. The user's job is the question, not the plumbing.
Checking assumptions before writing code prevents most failures. Verdent explored the API first — confirming field availability across all eight dimensions before writing a single query. Most AI tools skip this and start generating code immediately, which means runtime errors become the discovery mechanism. Exploring first cost 16 API calls and saved hours of debugging.
AI reviewing its own plan is a meaningful quality gate. The technical design wasn't just generated and executed. It was reviewed before any data was pulled — query strategy, storage format, visualization plan, each evaluated for soundness. This is the difference between "write code fast" and "build something you can trust."
Delivering a reusable project is fundamentally different from delivering a report. A report answers today's question. A set of standalone scripts answers the same question next week, next month, and for every new colleague who needs it — without another ticket in the queue. The shift from "get me this data" to "give me the ability to get this data" is what turns a one-off ask into lasting leverage.